Directional Variograms#
General#
With version 0.2.2, directional variograms have been introduced. A
directional variogram is a variogram where point pairs are only included into
the semivariance calculation if they fulfill a specified spatial relation.
This relation is expressed as a search area that identifies all
directional points for a given specific point. SciKit-GStat refers to this
point as poi (point of interest). The implementation is done by the
DirectionalVariogram class.
Understanding Search Area#
Note
The DirectionalVariogram is
in general capable of handling n-dimensional coordinates. The application
of directional dependency is, however, only applied to the first two
dimensions.
Understanding the search area of a directional is vital for using the
DirectionalVariogram class. The
search area is controlled by the
directional_model
property which determines the shape of the search area. The extend and
orientation of this area is controlled by the parameters:
As of this writing, SciKit-GStat supports three different search area shapes:
Additionally, the shape generation is controlled by the
tolerance parameter
(triangle,
compass) and
bandwidth parameter
(triangle,
circle). The
azimuth is used to rotate the
search area into a desired direction. An azimuth of 0° is heading East of the
coordinate plane. Positive values for azimuth rotate the search area
clockwise, negative values counter-clockwise.
The tolerance specifies how
far the angle (against ‘x-axis’) between two points can be off the azimuth to
be still considered as a directional point pair. Based on this definition,
two points at a larger distance would generally be allowed to differ more
from azimuth in terms of coordinate distance. Therefore the
bandwidth defines a maximum
coordinate distance, a point can have from the azimuth line.
The difference between the
triangle and the
compass search area is that
the triangle uses the bandwidth and the compass does not.
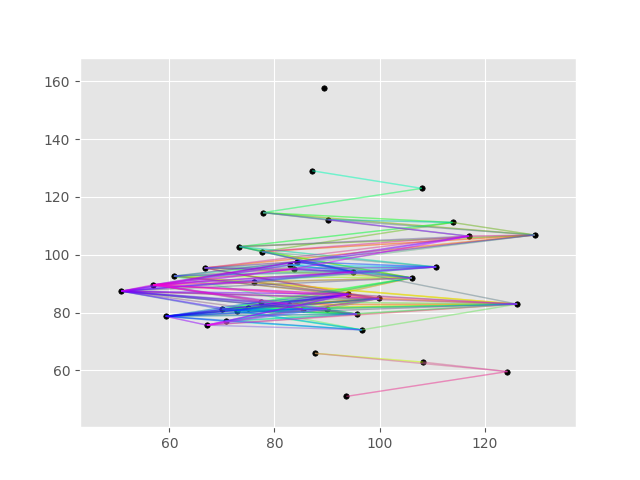
The DirectionalVariogram has a
function to plot the effect of the search area. The method is called
pair_field. Using
random coordinates, the visualization is shown below.
In [1]: from skgstat import DirectionalVariogram

In [2]: from skgstat.plotting import backend

In [3]: import numpy as np

In [4]: import matplotlib.pyplot as plt

In [5]: plt.style.use('ggplot')

In [6]: backend('matplotlib')

In [7]: np.random.seed(42)

In [8]: coords = np.random.gamma(15, 6, (40, 2))

In [9]: np.random.seed(42)

In [10]: vals = np.random.normal(5,1, 40)

In [11]: DV = DirectionalVariogram(coords, vals,
   ....:     azimuth=0,
   ....:     tolerance=45,
   ....:     directional_model='triangle')
   ....:

In [12]: DV.pair_field(plt.gca())
Out[12]: <Figure size 640x480 with 1 Axes>
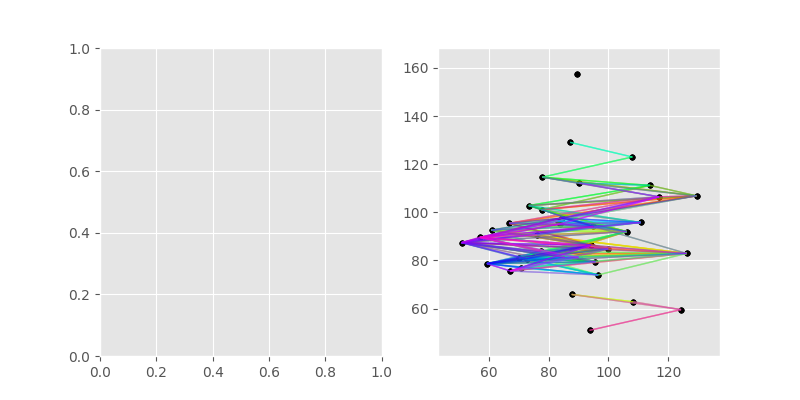
The model can easily be changed, using the
set_directional_model
function:
In [13]: fig, axes = plt.subplots(1, 2, figsize=(8, 4))

In [14]: DV.set_directional_model('triangle')

In [15]: DV.pair_field(plt.gca())
Out[15]: <Figure size 800x400 with 2 Axes>

In [16]: DV.pair_field(plt.gca())
Out[16]: <Figure size 800x400 with 2 Axes>

In [17]: fig.show()

In [18]: DV.set_directional_model('compass')

In [19]: DV.pair_field(plt.gca())
Out[19]: <Figure size 800x400 with 2 Axes>

In [20]: fig.show()

Directional variograms#
In principle, the DirectionalVariogram
can be used just like the Variogram base class.
In fact DirectionalVariogram inherits
most of the behaviour. All the functionality described in the previous
sections is added to the basic Variogram.
All other methods and attributes can be used in the same way.
Warning
In order to implement the directional dependency, some methods have been
rewritten in DirectionalVariogram.
Thus the following methods do not show the same behaviour:
DirectionalVariogram._calc_groups